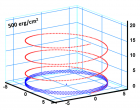
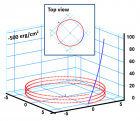
Figure 4
Mesoscopic irreversible thermodynamics of morphological evolution kinetics of helical conformation in bioproteins ‘DNA’ under the isothermal isobaric conditions
Tarik Omer Ogurtani* and Ersin Emre Oren
Published: 11 March, 2020 | Volume 4 - Issue 1 | Pages: 009-019
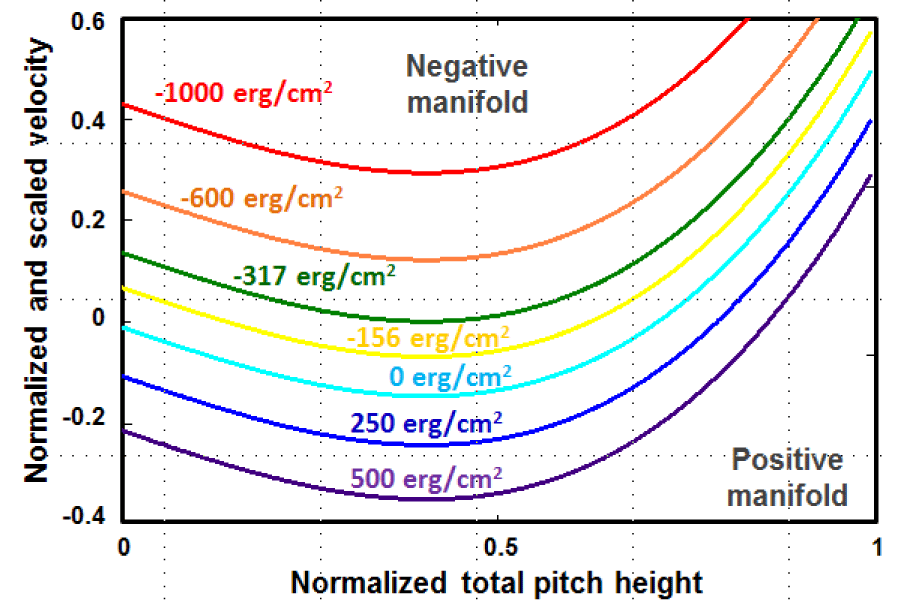
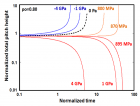
Figure 4:
The scaled pitch velocity versus total pitch height is plotted with respect to the selected values of the interfacial Gibbs specific free energy to show those two distinct manifolds separated by the velocity sign inversion line.
Read Full Article HTML DOI: 10.29328/journal.abse.1001008 Cite this Article Read Full Article PDF
More Images
Similar Articles
-
Peptide-based antifouling aptasensor for cardiac troponin I detection by surface plasmon resonance applied in medium sized Myocardial InfarctionJen-Tsai Liu*,Yi Wu,Jia Xin Che,Shwu Jen Chang,Ching-Jung Chen*. Peptide-based antifouling aptasensor for cardiac troponin I detection by surface plasmon resonance applied in medium sized Myocardial Infarction. . 2020 doi: 10.29328/journal.abse.1001007; 4: 001-008
Recently Viewed
-
A rare case of giant ovarian serous cystadenoma presenting as psuedo-meigs syndromeRichmond Ronald Gomes*,Sayeda Noureen,Habiba Akhter. A rare case of giant ovarian serous cystadenoma presenting as psuedo-meigs syndrome. Clin J Obstet Gynecol. 2021: doi: 10.29328/journal.cjog.1001078; 4: 010-014
-
Three visionaries for HRTJoseph Loze Onwude*. Three visionaries for HRT. Clin J Obstet Gynecol. 2021: doi: 10.29328/journal.cjog.1001077; 4: 007-009
-
The Utility of Acupuncture in Sports Medicine: A Review of the Recent LiteratureMichael Malone*. The Utility of Acupuncture in Sports Medicine: A Review of the Recent Literature. J Sports Med Ther. 2017: doi: 10.29328/journal.jsmt.1001004; 2: 020-027
-
Sinonasal Myxoma Extending into the Orbit in a 4-Year Old: A Case PresentationJulian A Purrinos*, Ramzi Younis. Sinonasal Myxoma Extending into the Orbit in a 4-Year Old: A Case Presentation. Arch Case Rep. 2024: doi: 10.29328/journal.acr.1001099; 8: 075-077
-
Sex after Neurosurgery–Limitations, Recommendations, and the Impact on Patient’s Well-beingMor Levi Rivka*, Csaba L Dégi. Sex after Neurosurgery–Limitations, Recommendations, and the Impact on Patient’s Well-being. J Neurosci Neurol Disord. 2024: doi: 10.29328/journal.jnnd.1001099; 8: 064-068
Most Viewed
-
Evaluation of Biostimulants Based on Recovered Protein Hydrolysates from Animal By-products as Plant Growth EnhancersH Pérez-Aguilar*, M Lacruz-Asaro, F Arán-Ais. Evaluation of Biostimulants Based on Recovered Protein Hydrolysates from Animal By-products as Plant Growth Enhancers. J Plant Sci Phytopathol. 2023 doi: 10.29328/journal.jpsp.1001104; 7: 042-047
-
Sinonasal Myxoma Extending into the Orbit in a 4-Year Old: A Case PresentationJulian A Purrinos*, Ramzi Younis. Sinonasal Myxoma Extending into the Orbit in a 4-Year Old: A Case Presentation. Arch Case Rep. 2024 doi: 10.29328/journal.acr.1001099; 8: 075-077
-
Feasibility study of magnetic sensing for detecting single-neuron action potentialsDenis Tonini,Kai Wu,Renata Saha,Jian-Ping Wang*. Feasibility study of magnetic sensing for detecting single-neuron action potentials. Ann Biomed Sci Eng. 2022 doi: 10.29328/journal.abse.1001018; 6: 019-029
-
Pediatric Dysgerminoma: Unveiling a Rare Ovarian TumorFaten Limaiem*, Khalil Saffar, Ahmed Halouani. Pediatric Dysgerminoma: Unveiling a Rare Ovarian Tumor. Arch Case Rep. 2024 doi: 10.29328/journal.acr.1001087; 8: 010-013
-
Physical activity can change the physiological and psychological circumstances during COVID-19 pandemic: A narrative reviewKhashayar Maroufi*. Physical activity can change the physiological and psychological circumstances during COVID-19 pandemic: A narrative review. J Sports Med Ther. 2021 doi: 10.29328/journal.jsmt.1001051; 6: 001-007

HSPI: We're glad you're here. Please click "create a new Query" if you are a new visitor to our website and need further information from us.
If you are already a member of our network and need to keep track of any developments regarding a question you have already submitted, click "take me to my Query."


