Figure 2
Fecal storage condition induces variations of microbial composition and differential interpretation of metagenomic analysis
Hansoo Park*, Gihyeon Kim†, Kyoung Wan Yoon†, Changho Park†, Kyu Hyuck Kang, Sujeong Kim, Youngmin Yoon, Sang Eun Lee and Yeongmin Kim
Published: 17 March, 2021 | Volume 5 - Issue 1 | Pages: 006-012
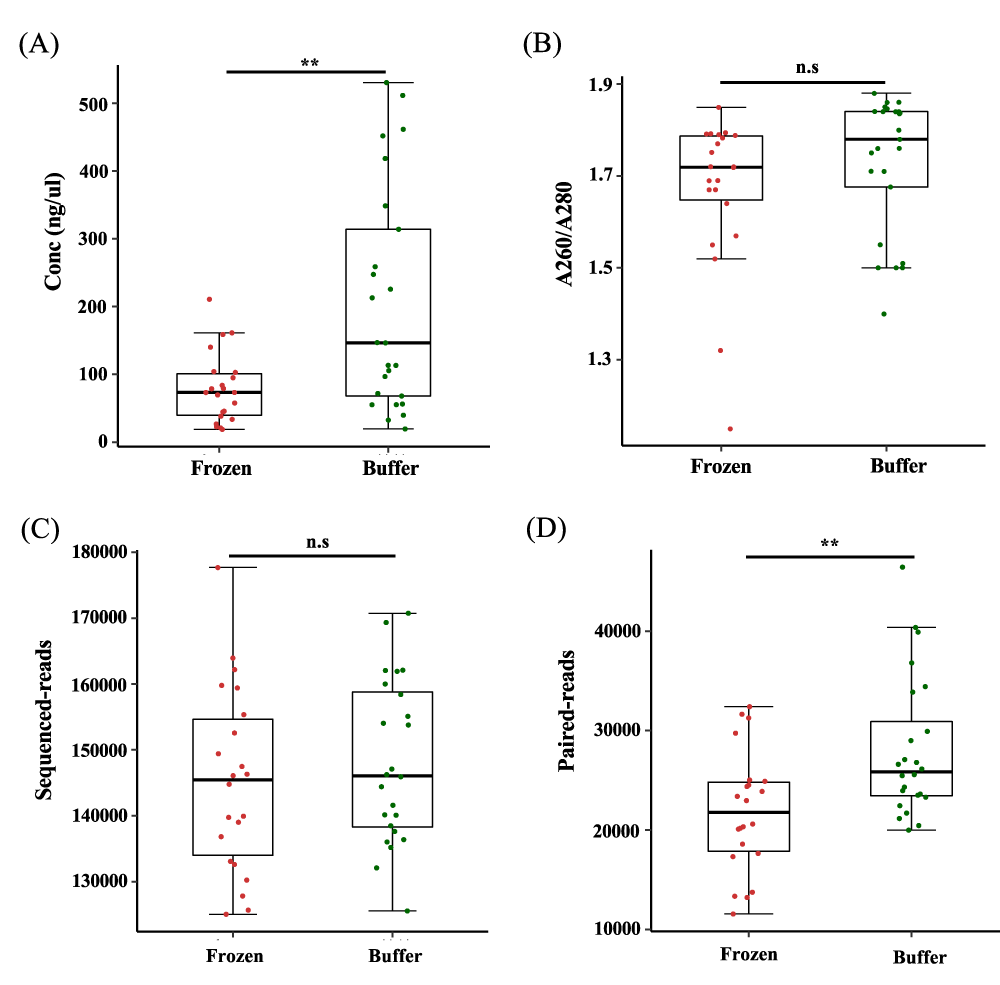
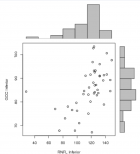
Figure 2:
Numbers of sequence reads and paired-end reads from feces stored in different conditions. (a) Concentration (Conc) of DNA from fecal samples stored frozen and in preservation buffer (n = 22 and n = 24, respectively). (b) Ratio of absorbance at 260 to 280 as an indicated of purity. (c) Number of sequence reads for the V3–V4 region obtained by Illumina 16S rRNA sequencing. (d) Number of paired-end reads from feces. n.s.: non-significant; **p < 0.005. Significance was evaluated by the Wilcoxon-Mann-Whitney U test. Whiskers error bars represent the distribution of relative abundance.
Read Full Article HTML DOI: 10.29328/journal.abse.1001011 Cite this Article Read Full Article PDF
More Images
Similar Articles
-
Mesoscopic irreversible thermodynamics of morphological evolution kinetics of helical conformation in bioproteins ‘DNA’ under the isothermal isobaric conditionsTarik Omer Ogurtani*,Ersin Emre Oren. Mesoscopic irreversible thermodynamics of morphological evolution kinetics of helical conformation in bioproteins ‘DNA’ under the isothermal isobaric conditions. . 2020 doi: 10.29328/journal.abse.1001008; 4: 009-019
-
Fecal storage condition induces variations of microbial composition and differential interpretation of metagenomic analysisHansoo Park*,Gihyeon Kim†,Kyoung Wan Yoon†, Changho Park†,Kyu Hyuck Kang,Sujeong Kim,Youngmin Yoon,Sang Eun Lee,Yeongmin Kim. Fecal storage condition induces variations of microbial composition and differential interpretation of metagenomic analysis. . 2021 doi: 10.29328/journal.abse.1001011; 5: 006-012
Recently Viewed
-
An Interesting Autopsy Case Report of Acute Respiratory FailureJasleen Bhatia* and AK Das. An Interesting Autopsy Case Report of Acute Respiratory Failure. Arch Pathol Clin Res. 2023: doi: 10.29328/journal.apcr.1001036; 7: 017-019
-
In vitro, Anti-oxidant, and Anti-inflammatory Activity of Kalanchoe pinnataWijeratne Mudiyanselage Swarna Menu*. In vitro, Anti-oxidant, and Anti-inflammatory Activity of Kalanchoe pinnata. Arch Pharm Pharma Sci. 2025: doi: 10.29328/journal.apps.1001064; 9: 001-008
-
Green Synthesis of Citrus sinensis Peel (Orange Peel) Extract Silver Nanoparticle and its Various Pharmacological ActivitiesJ Bagyalakshmi,M Prathiksha. Green Synthesis of Citrus sinensis Peel (Orange Peel) Extract Silver Nanoparticle and its Various Pharmacological Activities. Arch Pharm Pharma Sci. 2025: doi: 10.29328/journal.apps.1001065; 9: 009-013
-
Unveiling the Impostor: Pulmonary Embolism Presenting as Pneumonia: A Case Report and Literature ReviewSaahil Kumar,Karuna Sree Alwa*,Mahesh Babu Vemuri,Anumola Gandhi Ganesh Gupta,Nuthan Vallapudasu,Sunitha Geddada. Unveiling the Impostor: Pulmonary Embolism Presenting as Pneumonia: A Case Report and Literature Review. J Pulmonol Respir Res. 2025: doi: 10.29328/journal.jprr.1001065; 9: 001-005
-
Dengue Epidemic during COVID-19 Pandemic: Clinical and Molecular Characterization – A Study from Western RajasthanPraveen Kumar Rathore,Eshank Gupta,Prabhu Prakash. Dengue Epidemic during COVID-19 Pandemic: Clinical and Molecular Characterization – A Study from Western Rajasthan. Int J Clin Virol. 2025: doi: 10.29328/journal.ijcv.1001063; 9: 005-009
Most Viewed
-
Evaluation of Biostimulants Based on Recovered Protein Hydrolysates from Animal By-products as Plant Growth EnhancersH Pérez-Aguilar*, M Lacruz-Asaro, F Arán-Ais. Evaluation of Biostimulants Based on Recovered Protein Hydrolysates from Animal By-products as Plant Growth Enhancers. J Plant Sci Phytopathol. 2023 doi: 10.29328/journal.jpsp.1001104; 7: 042-047
-
Sinonasal Myxoma Extending into the Orbit in a 4-Year Old: A Case PresentationJulian A Purrinos*, Ramzi Younis. Sinonasal Myxoma Extending into the Orbit in a 4-Year Old: A Case Presentation. Arch Case Rep. 2024 doi: 10.29328/journal.acr.1001099; 8: 075-077
-
Feasibility study of magnetic sensing for detecting single-neuron action potentialsDenis Tonini,Kai Wu,Renata Saha,Jian-Ping Wang*. Feasibility study of magnetic sensing for detecting single-neuron action potentials. Ann Biomed Sci Eng. 2022 doi: 10.29328/journal.abse.1001018; 6: 019-029
-
Pediatric Dysgerminoma: Unveiling a Rare Ovarian TumorFaten Limaiem*, Khalil Saffar, Ahmed Halouani. Pediatric Dysgerminoma: Unveiling a Rare Ovarian Tumor. Arch Case Rep. 2024 doi: 10.29328/journal.acr.1001087; 8: 010-013
-
Physical activity can change the physiological and psychological circumstances during COVID-19 pandemic: A narrative reviewKhashayar Maroufi*. Physical activity can change the physiological and psychological circumstances during COVID-19 pandemic: A narrative review. J Sports Med Ther. 2021 doi: 10.29328/journal.jsmt.1001051; 6: 001-007

HSPI: We're glad you're here. Please click "create a new Query" if you are a new visitor to our website and need further information from us.
If you are already a member of our network and need to keep track of any developments regarding a question you have already submitted, click "take me to my Query."


