Figure 3
Fecal storage condition induces variations of microbial composition and differential interpretation of metagenomic analysis
Hansoo Park*, Gihyeon Kim†, Kyoung Wan Yoon†, Changho Park†, Kyu Hyuck Kang, Sujeong Kim, Youngmin Yoon, Sang Eun Lee and Yeongmin Kim
Published: 17 March, 2021 | Volume 5 - Issue 1 | Pages: 006-012
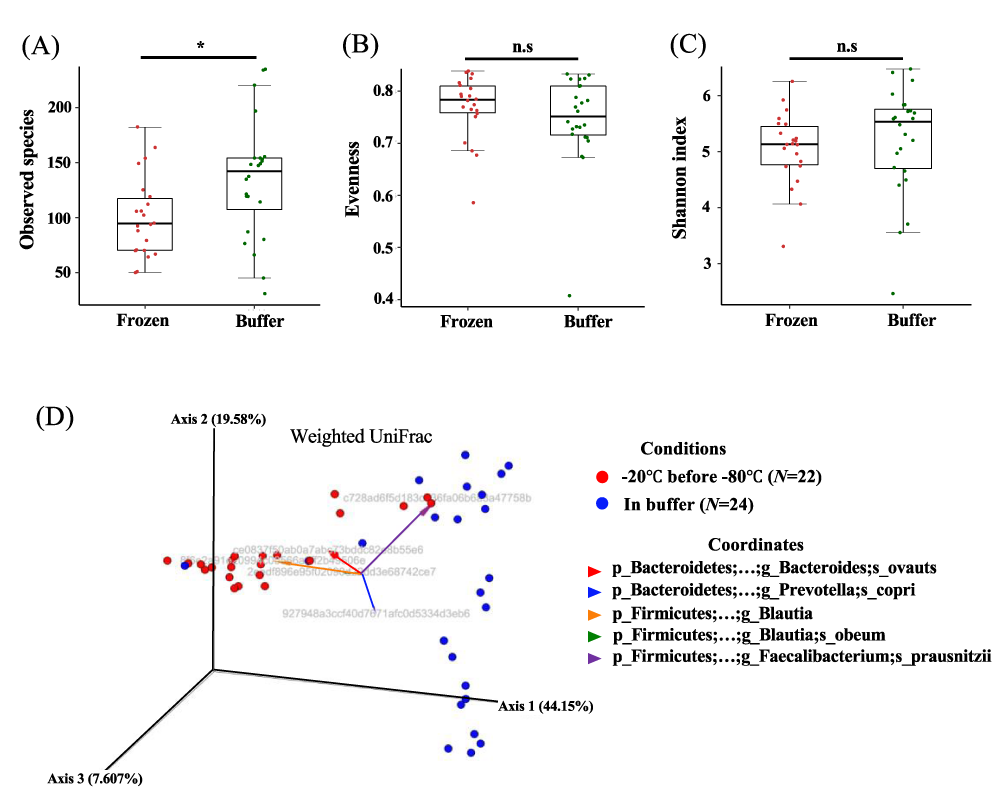
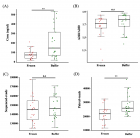
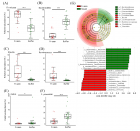
Figure 3:
Alpha diversity and beta diversity of individual feces stored under different conditions. (a) Number of observed species, (b) evenness, and (c) Shannon index for frozen and buffer-preserved feces. (d) Weighted UniFrac beta diversity. Grey sentences are OTUs (Operational Taxonomic Units). n.s.: non-significant; *p < 0.05. Significance was evaluated by the Wilcoxon-Mann-Whitney U test. Whiskers error bars represent the distribution of alpha diversity values. The significance of differences in beta diversity was calculated by PERMANOVA with 999 permutations.
Read Full Article HTML DOI: 10.29328/journal.abse.1001011 Cite this Article Read Full Article PDF
More Images
Similar Articles
-
Mesoscopic irreversible thermodynamics of morphological evolution kinetics of helical conformation in bioproteins ‘DNA’ under the isothermal isobaric conditionsTarik Omer Ogurtani*,Ersin Emre Oren. Mesoscopic irreversible thermodynamics of morphological evolution kinetics of helical conformation in bioproteins ‘DNA’ under the isothermal isobaric conditions. . 2020 doi: 10.29328/journal.abse.1001008; 4: 009-019
-
Fecal storage condition induces variations of microbial composition and differential interpretation of metagenomic analysisHansoo Park*,Gihyeon Kim†,Kyoung Wan Yoon†, Changho Park†,Kyu Hyuck Kang,Sujeong Kim,Youngmin Yoon,Sang Eun Lee,Yeongmin Kim. Fecal storage condition induces variations of microbial composition and differential interpretation of metagenomic analysis. . 2021 doi: 10.29328/journal.abse.1001011; 5: 006-012
Recently Viewed
-
Surgical Fetal Stem Cell Transplant into Heart Failure Patients Long-term Results at 14 YearsFederico Benetti*,Luis Geffner,Yan Duarte,Ernesto Peñaherrera. Surgical Fetal Stem Cell Transplant into Heart Failure Patients Long-term Results at 14 Years. J Stem Cell Ther Transplant. 2025: doi: 10.29328/journal.jsctt.1001045; 9: 001-005
-
A Mini Review of Newly Identified Omicron SublineagesDasaradharami Reddy K*,Anusha S,Palem Chandrakala. A Mini Review of Newly Identified Omicron Sublineages. Arch Case Rep. 2023: doi: 10.29328/journal.acr.1001082; 7: 066-076
-
Role of RBC Parameters to Differentiate between Iron Deficiency Anemia and Anemia of Chronic DiseasesReena Bhaisare*, Ravindranath M, Gurmeet Singh. Role of RBC Parameters to Differentiate between Iron Deficiency Anemia and Anemia of Chronic Diseases. J Hematol Clin Res. 2023: doi: 10.29328/journal.jhcr.1001024; 7: 021-024
-
A Rare Case of an Acquired Isolated Factor VII Deficiency was Discovered in a 23-Year-Old Female PatientZahra Kmira*, Sassi Nedia, Ben Yahia Noura, Ben Sayed Nesrine, Greisha Ahmed, Mootameri Wided, Bouteraa Walid, Zaier Monia, Ben Youssef Yosra, Brahem Nejia, Haifa Regaieg, Khelif Abderrahim. A Rare Case of an Acquired Isolated Factor VII Deficiency was Discovered in a 23-Year-Old Female Patient. J Hematol Clin Res. 2023: doi: 10.29328/journal.jhcr.1001025; 7: 025-028
-
Obesity in Patients with Chronic Obstructive Pulmonary Disease as a Separate Clinical PhenotypeDaria A Prokonich*, Tatiana V Saprina, Ekaterina B Bukreeva. Obesity in Patients with Chronic Obstructive Pulmonary Disease as a Separate Clinical Phenotype. J Pulmonol Respir Res. 2024: doi: 10.29328/journal.jprr.1001060; 8: 053-055
Most Viewed
-
Evaluation of Biostimulants Based on Recovered Protein Hydrolysates from Animal By-products as Plant Growth EnhancersH Pérez-Aguilar*, M Lacruz-Asaro, F Arán-Ais. Evaluation of Biostimulants Based on Recovered Protein Hydrolysates from Animal By-products as Plant Growth Enhancers. J Plant Sci Phytopathol. 2023 doi: 10.29328/journal.jpsp.1001104; 7: 042-047
-
Sinonasal Myxoma Extending into the Orbit in a 4-Year Old: A Case PresentationJulian A Purrinos*, Ramzi Younis. Sinonasal Myxoma Extending into the Orbit in a 4-Year Old: A Case Presentation. Arch Case Rep. 2024 doi: 10.29328/journal.acr.1001099; 8: 075-077
-
Feasibility study of magnetic sensing for detecting single-neuron action potentialsDenis Tonini,Kai Wu,Renata Saha,Jian-Ping Wang*. Feasibility study of magnetic sensing for detecting single-neuron action potentials. Ann Biomed Sci Eng. 2022 doi: 10.29328/journal.abse.1001018; 6: 019-029
-
Pediatric Dysgerminoma: Unveiling a Rare Ovarian TumorFaten Limaiem*, Khalil Saffar, Ahmed Halouani. Pediatric Dysgerminoma: Unveiling a Rare Ovarian Tumor. Arch Case Rep. 2024 doi: 10.29328/journal.acr.1001087; 8: 010-013
-
Physical activity can change the physiological and psychological circumstances during COVID-19 pandemic: A narrative reviewKhashayar Maroufi*. Physical activity can change the physiological and psychological circumstances during COVID-19 pandemic: A narrative review. J Sports Med Ther. 2021 doi: 10.29328/journal.jsmt.1001051; 6: 001-007

HSPI: We're glad you're here. Please click "create a new Query" if you are a new visitor to our website and need further information from us.
If you are already a member of our network and need to keep track of any developments regarding a question you have already submitted, click "take me to my Query."


