Figure 4
Fecal storage condition induces variations of microbial composition and differential interpretation of metagenomic analysis
Hansoo Park*, Gihyeon Kim†, Kyoung Wan Yoon†, Changho Park†, Kyu Hyuck Kang, Sujeong Kim, Youngmin Yoon, Sang Eun Lee and Yeongmin Kim
Published: 17 March, 2021 | Volume 5 - Issue 1 | Pages: 006-012

Figure 4:
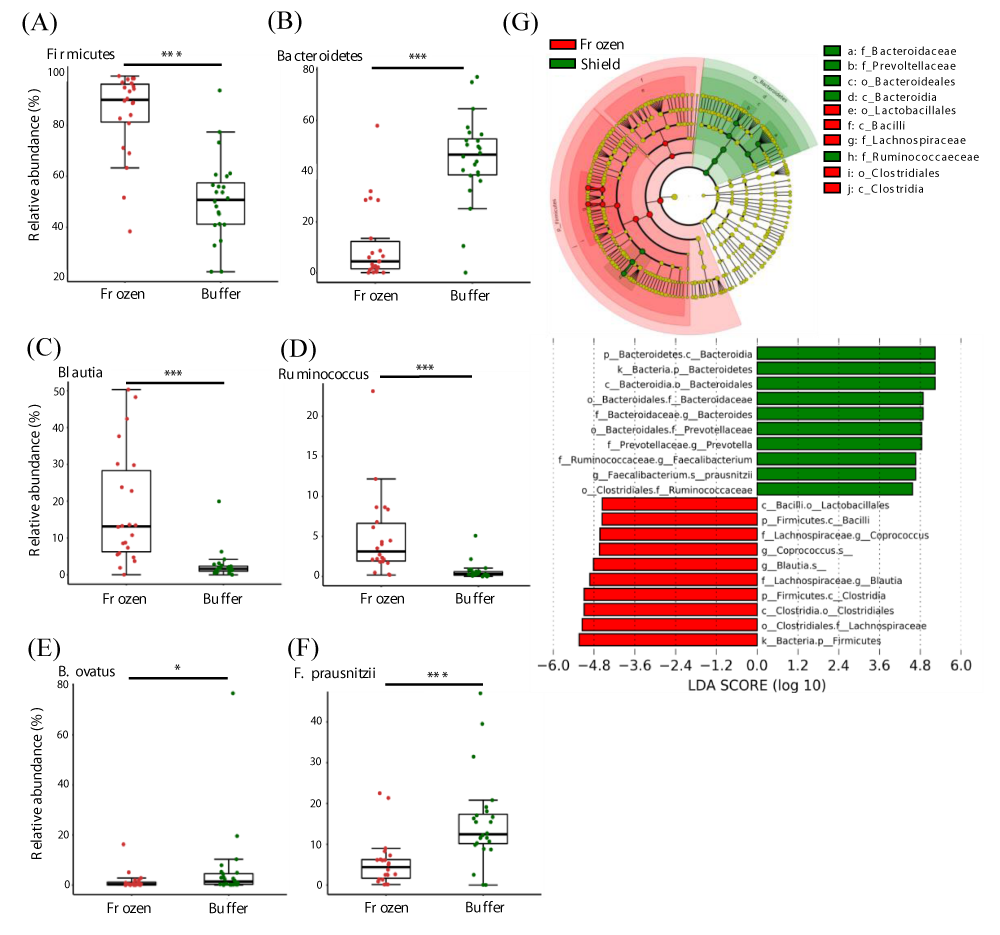
Differences in microbial abundances between frozen and buffer-preserved feces. Relative abundance of various microbes with different abundances (a and b) at the phylum level, (c and d), genus level, and (e and f) species level. (g) A taxonomic cladogram and a plot of linear discriminant analysis (LDA) scores from linear discriminant analysis effect size (LEfSe) illustrating the microbes that differ significantly between frozen and buffer-preserved feces (|LDA score| > 4.5). Each panel is ordered by the maximum relative abundance (a–f). *p < 0.05; ***p < 0.0005. Significance was evaluated by the Wilcoxon-Mann-Whitney U test. Whiskers error bars represent the distribution of observed relative abundance.
Read Full Article HTML DOI: 10.29328/journal.abse.1001011 Cite this Article Read Full Article PDF
More Images
Similar Articles
-
Mesoscopic irreversible thermodynamics of morphological evolution kinetics of helical conformation in bioproteins ‘DNA’ under the isothermal isobaric conditionsTarik Omer Ogurtani*,Ersin Emre Oren. Mesoscopic irreversible thermodynamics of morphological evolution kinetics of helical conformation in bioproteins ‘DNA’ under the isothermal isobaric conditions. . 2020 doi: 10.29328/journal.abse.1001008; 4: 009-019
-
Fecal storage condition induces variations of microbial composition and differential interpretation of metagenomic analysisHansoo Park*,Gihyeon Kim†,Kyoung Wan Yoon†, Changho Park†,Kyu Hyuck Kang,Sujeong Kim,Youngmin Yoon,Sang Eun Lee,Yeongmin Kim. Fecal storage condition induces variations of microbial composition and differential interpretation of metagenomic analysis. . 2021 doi: 10.29328/journal.abse.1001011; 5: 006-012
Recently Viewed
-
Adult Neurogenesis: A Review of Current Perspectives and Implications for Neuroscience ResearchAlex, Gideon S*,Olanrewaju Oluwaseun Oke,Joy Wilberforce Ekokojde,Tolulope Judah Gbayisomore,Martina C. Anene-Ogbe,Farounbi Glory,Joshua Ayodele Yusuf. Adult Neurogenesis: A Review of Current Perspectives and Implications for Neuroscience Research. J Neurosci Neurol Disord. 2024: doi: 10.29328/journal.jnnd.1001102; 8: 106-114
-
Late discover of a traumatic cardiac injury: Case reportBenlafqih C,Bouhdadi H*,Bakkali A,Rhissassi J,Sayah R,Laaroussi M. Late discover of a traumatic cardiac injury: Case report. J Cardiol Cardiovasc Med. 2019: doi: 10.29328/journal.jccm.1001048; 4: 100-102
-
A two-phase sonographic study among women with infertility who first had normal sonographic findingsKalu Ochie*,Abraham John C. A two-phase sonographic study among women with infertility who first had normal sonographic findings. Clin J Obstet Gynecol. 2022: doi: 10.29328/journal.cjog.1001117; 5: 101-103
-
Sinonasal Myxoma Extending into the Orbit in a 4-Year Old: A Case PresentationJulian A Purrinos*, Ramzi Younis. Sinonasal Myxoma Extending into the Orbit in a 4-Year Old: A Case Presentation. Arch Case Rep. 2024: doi: 10.29328/journal.acr.1001099; 8: 075-077
-
Analysis of Psychological and Physiological Responses to Snoezelen Multisensory StimulationLucia Ludvigh Cintulova,Jerzy Rottermund,Zuzana Budayova. Analysis of Psychological and Physiological Responses to Snoezelen Multisensory Stimulation. J Neurosci Neurol Disord. 2024: doi: 10.29328/journal.jnnd.1001103; 8: 115-125
Most Viewed
-
Evaluation of Biostimulants Based on Recovered Protein Hydrolysates from Animal By-products as Plant Growth EnhancersH Pérez-Aguilar*, M Lacruz-Asaro, F Arán-Ais. Evaluation of Biostimulants Based on Recovered Protein Hydrolysates from Animal By-products as Plant Growth Enhancers. J Plant Sci Phytopathol. 2023 doi: 10.29328/journal.jpsp.1001104; 7: 042-047
-
Sinonasal Myxoma Extending into the Orbit in a 4-Year Old: A Case PresentationJulian A Purrinos*, Ramzi Younis. Sinonasal Myxoma Extending into the Orbit in a 4-Year Old: A Case Presentation. Arch Case Rep. 2024 doi: 10.29328/journal.acr.1001099; 8: 075-077
-
Feasibility study of magnetic sensing for detecting single-neuron action potentialsDenis Tonini,Kai Wu,Renata Saha,Jian-Ping Wang*. Feasibility study of magnetic sensing for detecting single-neuron action potentials. Ann Biomed Sci Eng. 2022 doi: 10.29328/journal.abse.1001018; 6: 019-029
-
Pediatric Dysgerminoma: Unveiling a Rare Ovarian TumorFaten Limaiem*, Khalil Saffar, Ahmed Halouani. Pediatric Dysgerminoma: Unveiling a Rare Ovarian Tumor. Arch Case Rep. 2024 doi: 10.29328/journal.acr.1001087; 8: 010-013
-
Physical activity can change the physiological and psychological circumstances during COVID-19 pandemic: A narrative reviewKhashayar Maroufi*. Physical activity can change the physiological and psychological circumstances during COVID-19 pandemic: A narrative review. J Sports Med Ther. 2021 doi: 10.29328/journal.jsmt.1001051; 6: 001-007

HSPI: We're glad you're here. Please click "create a new Query" if you are a new visitor to our website and need further information from us.
If you are already a member of our network and need to keep track of any developments regarding a question you have already submitted, click "take me to my Query."


